


Context
Long haul driving and technology
In the fall of 2024, my team of HCI master’s students and I were contracted by Verizon to help research and provide a tailored solution for their version of driver coaching. We honed in on learning more about how coaching can alleviate some of the key obstacles affecting Large Haul Trucking - a $34.5 billion industry - and by the end of the semester, we delivered a robust, thoroughly-tested answer to our findings.
Want to see our solution?
Overview
Micromanaging Safety
Accidents happen, especially for large truck drivers. To alleviate this, truck fleets use tools to monitor driver hours and habits called Electronic Logging Devices. Applications take advantage of the recorded data to provide fleet managers with an oversight of driver safety.
These tools can help, but drivers often feel over surveilled by the very tools and regulations that are meant to keep them safe.
Rather than a tool to improve safety, these tracking technologies instead become another distraction, so then the question becomes...

How might we leverage technology driven coaching to enhance driver retention, satisfaction, and performance in the trucking industry while aligning the goals of both drivers and managers?
Initial Research
Getting to understand our truck drivers
What incentivizes drivers to drive better? How does self-coaching improve driver retention rates? What stops drivers from using self-coaching tools more often? To truly answer these questions, we conducted the following methods:
Website Teardown
for insight on what Verizon currently uses, to insure our end result is cost effective
products
Competitive Analysis
to understand current coaching technologies and seeing what works and what doesn't
solutions
User Interviews
for rich, story-driven insight on truckers' experience with coaching technologies
interviews
Survey
for providing quantifiable, large scale data on coaching needs, with
responses

Surveys, teardowns, competitive analysis, and user interviews led to a rich affinity board, and many (many) hours of insights
Initial Research
We discovered a frustrating and unreliable solution space
Little Input from Drivers
Systems don’t give users an opportunity to do anything about inaccuracies or incidents the drivers felt deserved more context.
“The system catches if someone cuts him off but it still leaves an error on the driver’s score, even if it wasn’t his fault, and they can't do anything about it”
User Comment
Braking and Acceleration is priority
We need to make a tool that plays into what drivers prioritize- braking and acceleration.
Braking/acceleration marked as the number 1 skill that drivers were monitored on from survey analysis, accounting for about 50% of all feedback listed
Data Insight
Inaccurate systems
The technology isn’t always accurate, reducing faith in the system's effectiveness.
“...a road for the speed limit sign says 55, but the system mistakenly believes that the speed limit is only 35...”
Survey Result
Intrusive Features
Drivers spend more time worrying about whether they’re performing for the system rather than actually driving safely.
“...instead of stopping for that yellow light I tend to now just keep going through it instead of stressing out about getting a braking ding."
Product Testimonial
Importance of Transparency
Good communication and transparency improve morale, which leads to an increase in effectiveness.
Strong correlation found between driver knowing the metrics of their "grade" and system feedback feeling effective
Data Insight
Design Requirements and User Needs
User needs led to key design requirements for our process
We developed a series of user needs and design implications to guide our design process
Users need to…
So system should…
Ideation
3 overarching ideas for our solution
Using worst possible ideas, S.C.A.M.P.E.R, and, classic brainstorming, we came up with three concepts that matched all our needs
The Wallet

Encourages and supports good driving by providing points for consistency that drivers can redeem for bonuses or gifts

The Post Shift Report

A report that tracks and reviews growth over time, with information letting you know your performance after a shift
Ideation Review
User feedback pointed to personalization and engagement
To understand the strengths and weaknesses of our designs, we conducted semi-structured interviews with our client, surveys sent out to the Verizon Connect team, and discussions with second-year students in the program. We found 3 key insights…
Prioritize the Engaged Driver
We should focus on crafting a solution that enhances the motivation of drivers who are already eager to improve.
Promote driver engagement through personalization.
Our research indicated the importance of empowering drivers by enhancing their control within the application.
Consider how to break up information
Users can feel overwhelmed by a large volume of information. Moving forward, info needs to be relevant and succinct.

Ideation Review
We created a cohesive architecture for driver coaching
We decided to hone in our other two concepts and developed an appropriate information architecture that accommodates both.

The customizable dashboard is a total culmination of a drivers' habits over the course of their driving and offers detailed insights about a drivers' behaviors customized to their needs.
The post-shift report (which we later renamed to the cycle report) is a weekly summary of a drivers' key incidents and patterns, meant for drivers to see how their driving looks over the course of the week.
This led us to develop some key lo fidelity wireframes, including…

A dashboard showing lifetime stats and fleet leaderboard, providing a home for all things driver coaching

The shift report points out weekly updates about driver patterns

An exoneration form allows users to see each recorded incidence and submit a form to offer their own input
Personal Contribution
I focused on a clear and relevant cycle report
I focused on the creation of a cycle report that prioritized weekly improvements and gave users clear and transparent access to relevant data-accessible as a report after each driver shift.


My initial design focused on highlighting information relevant to our stakeholders. Since drivers typically get paid per mile, that was one of the first sources of info presented.
Since the system we were adapting was largely focused on detecting incidents, I tried to make highlights a section that recognized patterns of growth in the driver, including incident reduction, fuel efficiency, and braking. All of these highlights were based on existing affordances of Verizon Connect
Users also have clear and immediate access to any incidents that the system caught them making. I positioned this below highlights as I wanted to emphasize positives first. However, for the sake of transparency, all incidents are accessible.
By pressing on an incident, a user could see a breakdown of why the system marked them down for it, with plans for a rear/front view video and analysis of the issue.
Additionally, if a user felt something to be inaccurate about the incident, they can choose to request an exoneration, where they can explain why they felt the issue was missing important details
Feedback Process
We received feedback from drivers in the field
To test our lo fidelity wireframes, we conducted a task walkthrough with 4 drivers going over 7 key flows in our design, then questioned our drivers on the usability and effectiveness of our current design.

That led to several key improvements in the overall application, and below are the key iterations my partner Jessica and I made in my design.
Iteration 1
Improving how growth gets visualized
Truck drivers are busy, and when we talked to them they highlighted that it wasn't immediately clear how they're growing. I improved this by incorporating clear color associations and visible positive growth.

No visual distinction between “last week” and “average” improvement. too much info, and not enough is clear

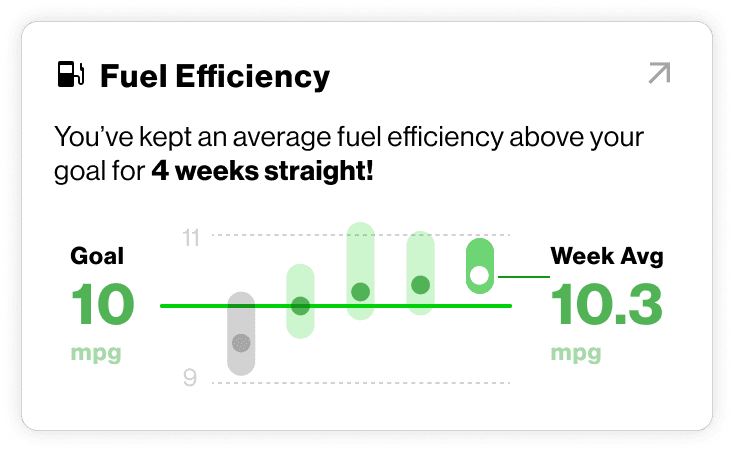
Use of green to emphasize growth, clear line graph showing goal fuel efficiency and effective driver average
Iteration 2
Making distinct parts of the report more accessible
User interviews showed me that our users didn't know that incident reviews and daily reports were accessible to them, but that these are still both important to review. I improved this by incorporating clear tabs and reducing necessary clicks from the report.

Incidents and daily reports hidden in flow that isn’t immediately obvious to user, unclear of how to reach it

Highlights start first, but incidents and daily reports are immediately accessible from Cycle Report navigation
Iteration 3
Improving the context of incident exoneration
In our wireframes, not only was our exoneration flow tucked at the very bottom of an incident overview page, but it was also worded in a way that immediately put drivers on the defensive. Users highlighted that this made it hard for them to know what to do, so I clarified the wording and improved access to the function.

Request exoneration located at the very bottom, and puts drivers in a mindset to defend themselves, dissuading action.

Added labels to view nodes, and moved "clarify incident" to middle to promote ease of action when necessary.
Hi Fidelity
We developed high fidelity in line with Verizon Standards
With our new feedback in mind, and a push towards finalization, we developed our final hi fidelity design

Final Design
Driver coaching - growth centered and customizable


Key Findings
So what does this mean for Verizon's future endeavors?
Transparency in Data Collection
Drivers value transparency regarding the metrics being tracked and how they influence their performance scores. Clearly presenting this information builds trust and encourages engagement.
Positive Coaching Approach
Coaching should emphasize positive reinforcement and improvement rather than focusing solely on mistakes. Encouraging progress through supportive feedback motivates drivers to engage with the system.
Empowering Drivers with Feedback
Feedback should be placed in the hands of the driver, allowing them to access and interpret their data independently. Customizable features can help drivers tailor the app to their individual needs and goals.
Ease of Use and Schedule Alignment
The system needs to be intuitive and seamlessly integrate into a driver’s typical schedule, minimizing disruption to their workflow while providing accessible and actionable insights.
Conclusion
A final thanks to my team and Verizon

Lessons Learned
Importance of clear coordination and task distribution
How to conduct effective research methods
Challenges Experienced
Finding interview participants in line with our target user was difficult
Difficulties in coordinating different feature functionalities
What could’ve been different
Creating a clear information architecture earlier in the process to guide our cross-feature prototyping
conducting more robust surveys
Focus more on fleshing out key features
What Went Well
Excellent team collaboration!
weaknesses felt compensated by others’ strengths
Consistently good communication with our client
Drivers had strong positive reaction to our design